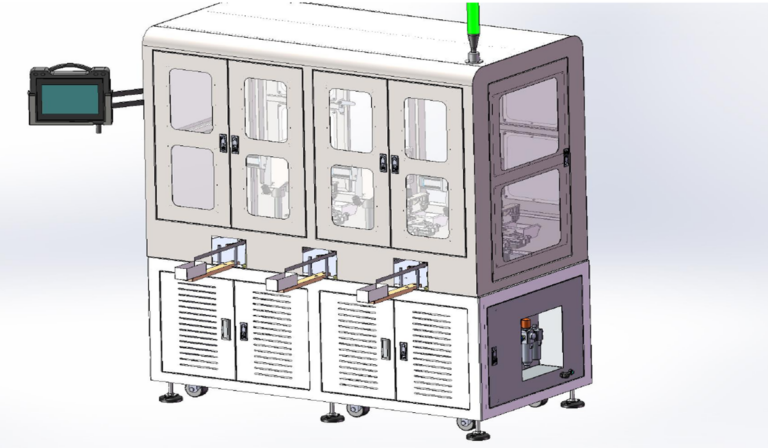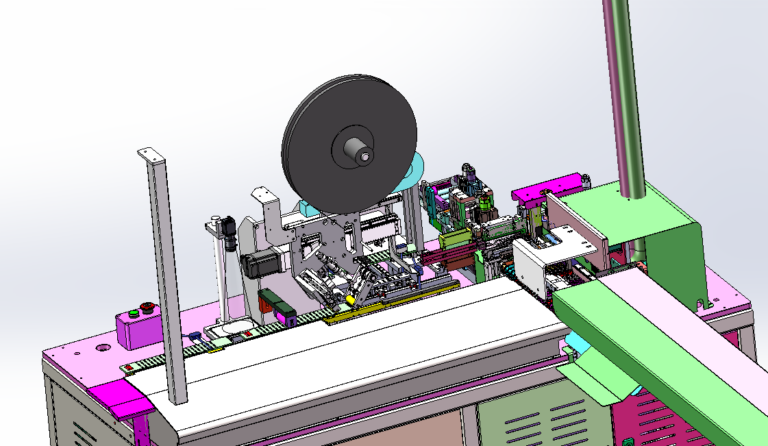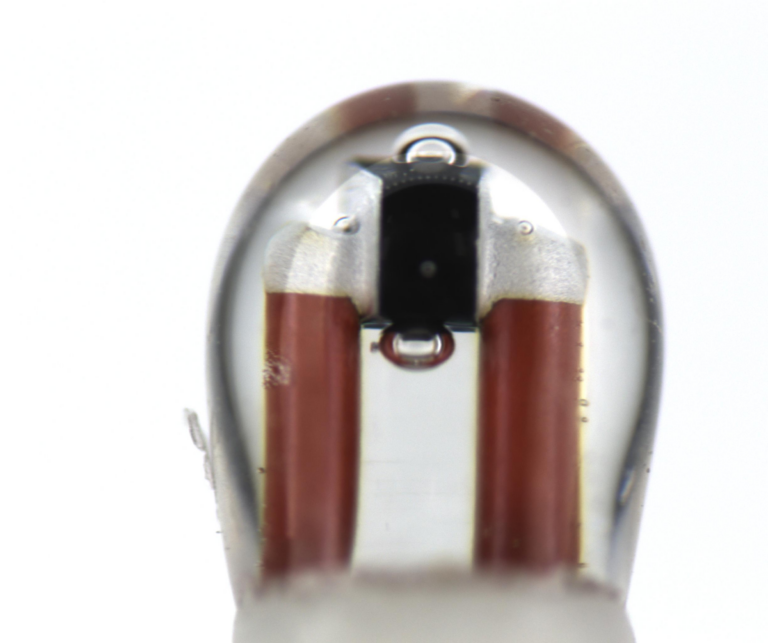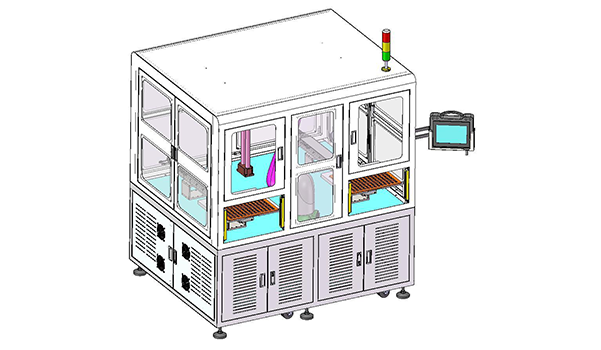
A temperature sensor production line may look simple at first:
Replace each manual process with an automated machine.
But in this drive motor temperature sensor automation line project, the real challenge was not finding an automated machine for every individual process.
The line had to connect:
Wire Cutting and Stripping → Tinning and Board Loading → NTC Resistance Welding → CCD Inspection → Silicone Coating → Curing → Housing Assembly → Epoxy Dispensing → Secondary Curing → Terminal Crimping → Sleeve and Connector Assembly → Performance Testing → Visual Inspection → Packaging
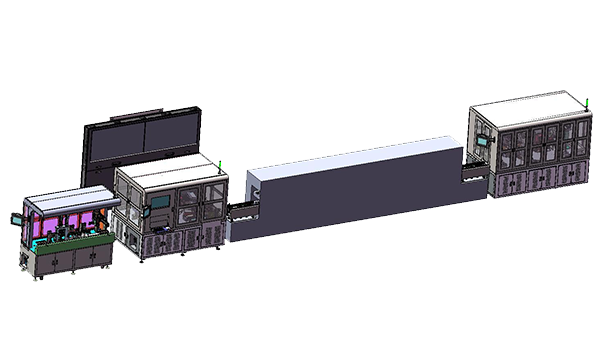
This is no longer a collection of independent workstations. It is an automated assembly line that combines assembly, welding, coating, curing, crimping, and inspection.
The planned output was approximately 20,000 pieces per day, while the rated capacities of different processes ranged from 800 PCS/H to 14,000 PCS/H.
So the real engineering question was:
How can processes with very different capacities work toward the same production target, instead of having every machine simply run as fast as possible?
For similar NTC temperature sensor applications, Robotlyne’s NTC Sensor Production Automation solutions are also organized around process modules such as wire cutting, welding, inspection, coating, dispensing, and testing, rather than treating the entire production line as one oversized special-purpose machine.
Why an Automated Assembly Line Does Not Mean Every Process Must Be Fully Automated
One of the most important aspects of this project is that the design did not assume:
Fully Automated
had to apply to every manufacturing step.
The process plan included:
- automatic wire cutting, stripping, and board loading;
- automatic NTC resistance welding;
- automatic CCD inspection;
- automatic silicone coating and curing;
- automatic epoxy dispensing;
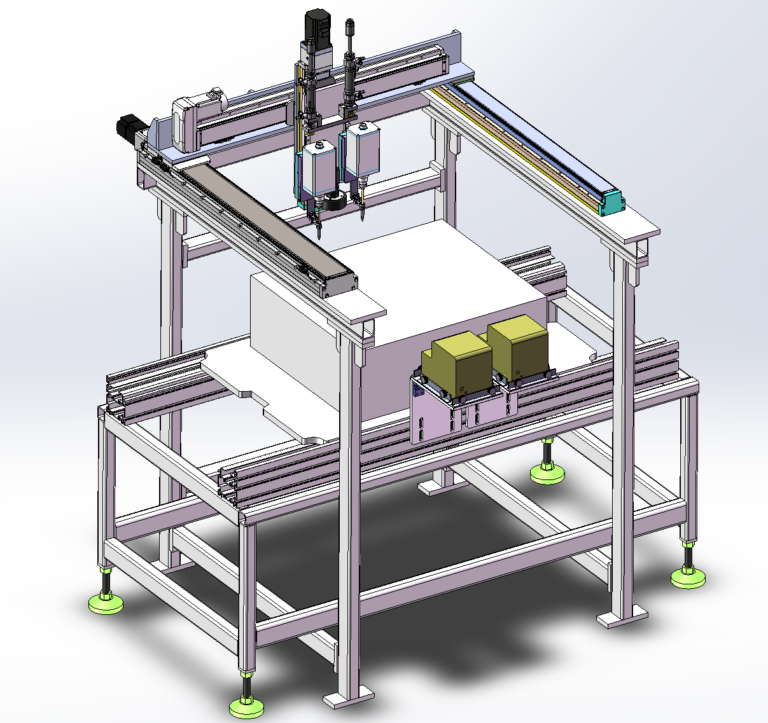
- semi-automatic terminal crimping;
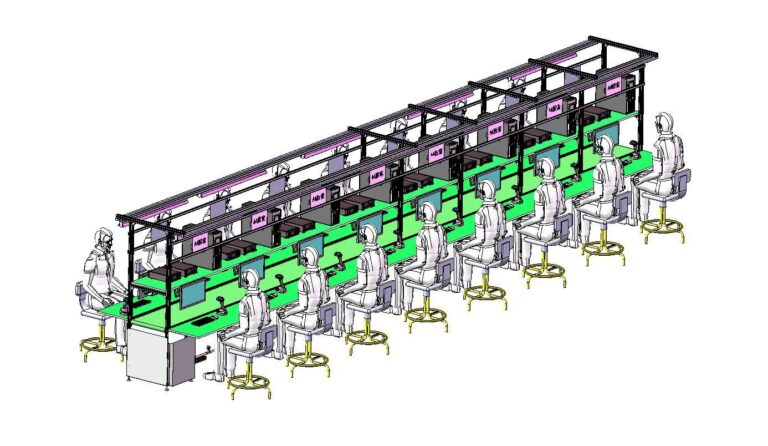
- manual or semi-automatic operations for some downstream assembly, inspection, and packaging steps.
This is much closer to how real manufacturing automation projects are designed.
If a process:
- represents only a small portion of labor time;
- is difficult to automate;
- changes frequently between products;
- requires an automation investment that is much higher than the labor savings;
then forcing that process into full automation does not necessarily improve the overall line.
So when designing an automated assembly line, the first question should be:
Which Process Should Be Automated?
not:
How Do We Automate Everything?
Automation should first be applied to processes that involve:
- highly repetitive work;
- strict consistency requirements;
- obvious manual bottlenecks;
- significant influence on overall production capacity.
Why the Entire Line Cannot Be Designed Around One Common Equipment Capacity
The equipment capacities in this project vary significantly.
The front-end wire cutting and board-loading equipment is rated at approximately:
2,000–2,200 PCS/H
The dual-station NTC resistance welding equipment:
1,600–2,000 PCS/H
Optional CCD inspection:
1,800–2,400 PCS/H
Silicone coating:
10,000–14,000 PCS/H
Epoxy dispensing:
1,800–2,500 PCS/H
Terminal crimping and housing insertion:
800 PCS/H per machine
These figures highlight an important point:
An automated assembly line is not simply a row of machines with the same cycle time.
If every machine were designed around:
2,000 PCS/H
then a silicone coating machine capable of 10,000–14,000 PCS/H would be significantly underutilized.
On the other hand, if every station were designed around the coating machine’s capacity, the project would require unnecessary investment.
A more practical approach is to configure each process around its own optimal operating mode, then connect the processes through:
Buffers + Batch Processing + Parallel Stations
Why the Front-End Wire Processing Equipment Influences Many Downstream Decisions
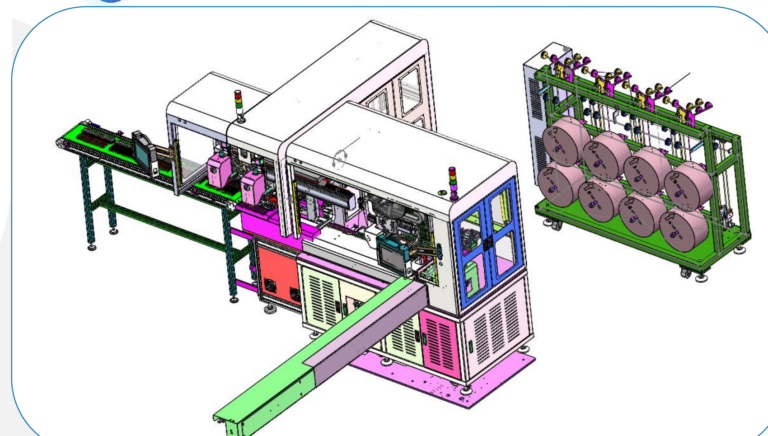
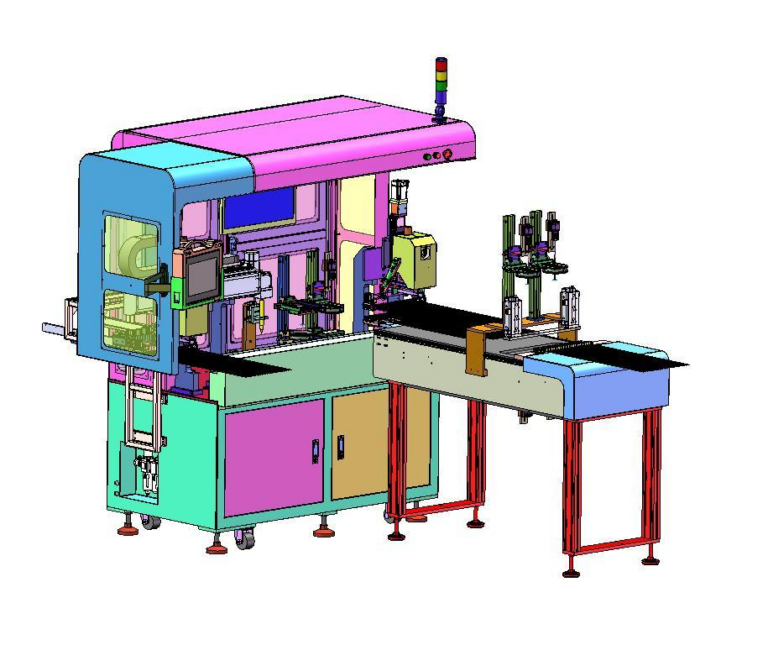
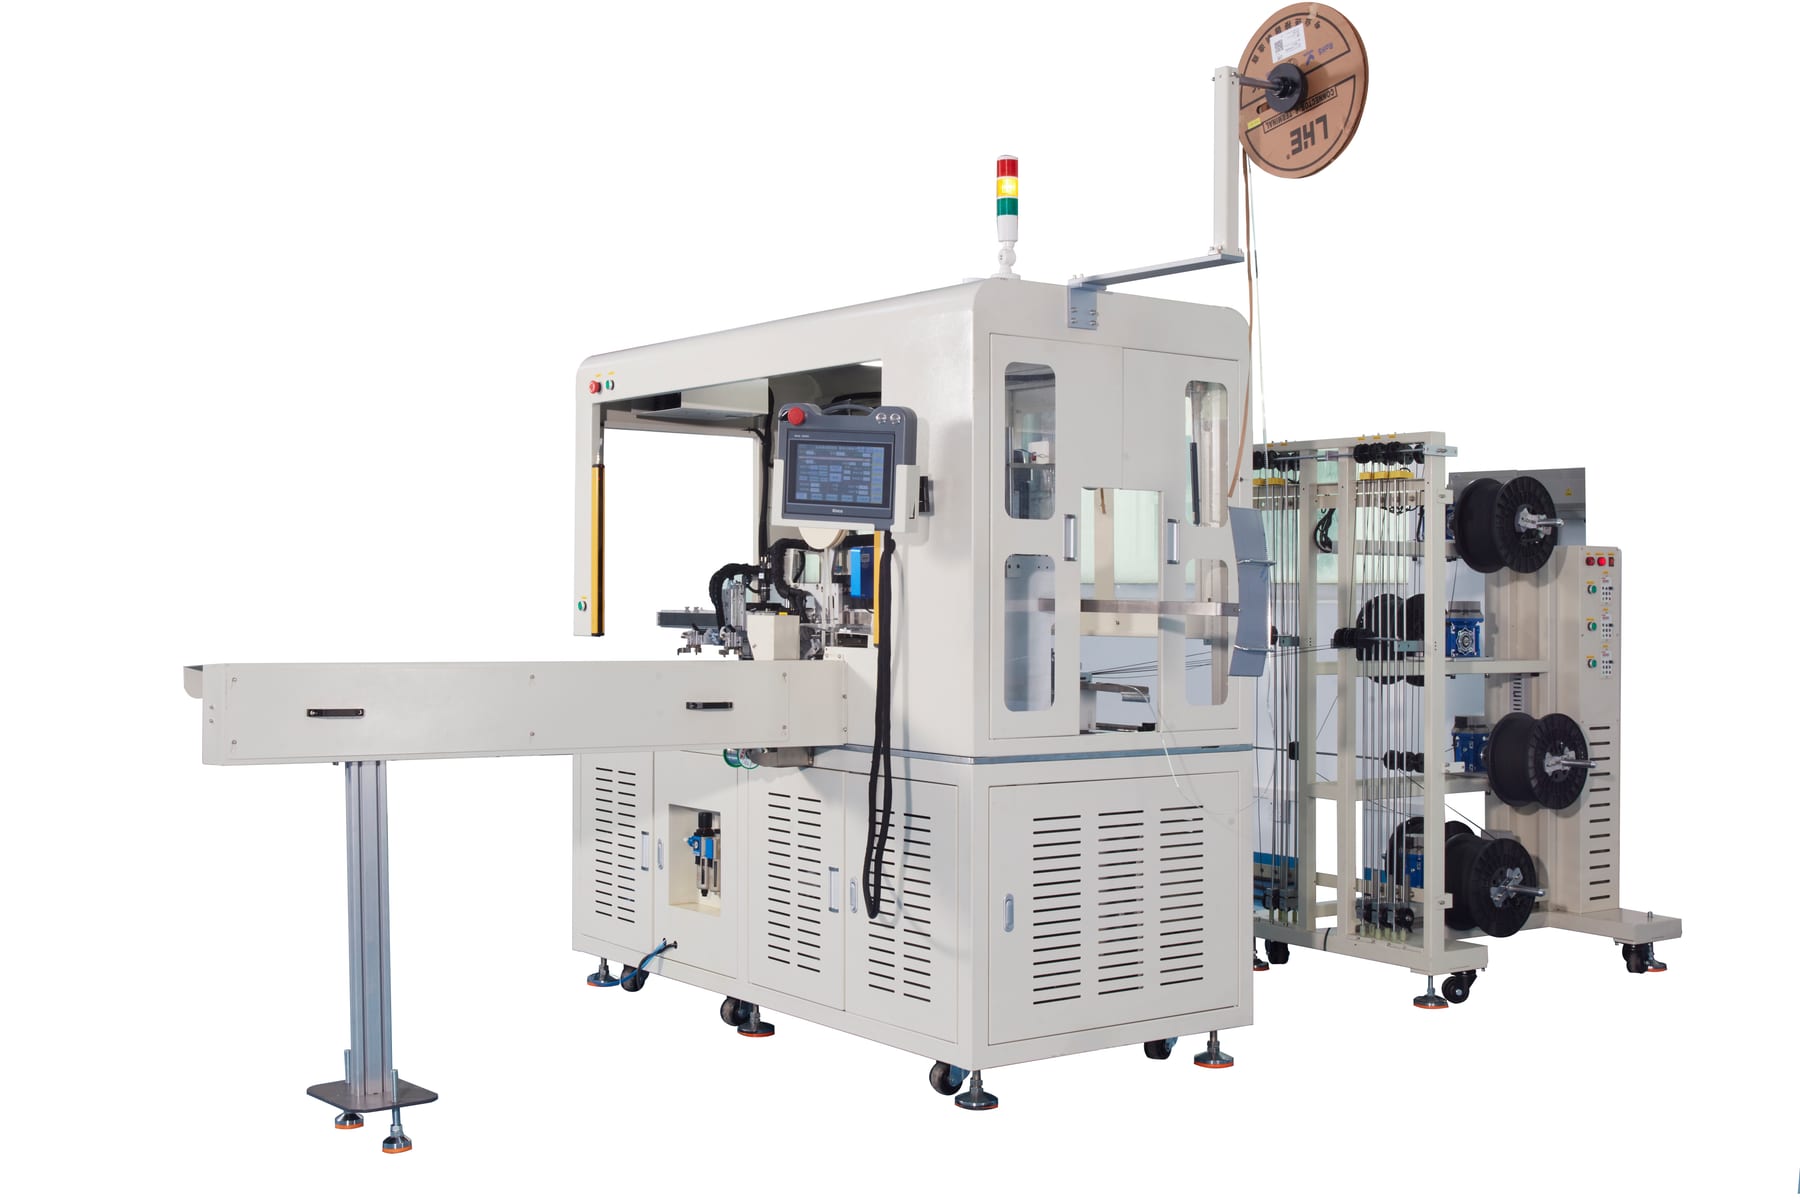
The front-end machine handles:
Wire Feeding
↓
Cutting
↓
Stripping
↓
Flux Application
↓
Tinning
↓
Board Loading
↓
Tape Application
↓
CCD Checking
↓
Finished Board Discharge
It supports five wire-feeding reels, with a confirmed wire-length range of:
50–1,500 mm
Depending on wire length, its output is approximately:
2,000–2,200 PCS/H
The importance of this stage goes beyond cutting wires.
From this point onward, the product is placed onto a:
Wire Board
This process board continues through:
- NTC welding;
- CCD inspection;
- downstream material handling.
So the front-end process does more than prepare the product.
It also establishes the:
Material Carrier System
used throughout subsequent stages of the line.
Why the Number of Process Boards Can Become a Hidden Capacity Limit
Based on a 10-hour working day, the project requires at least:
1,000 Active Wire Boards
for production.
If the boards are expected to complete a full-day circulation cycle, another:
1,000 Boards
are recommended for return circulation.
This number is easy to overlook.
When calculating production capacity, attention usually goes to:
- machine cycle time;
- robot speed;
- conveyor speed;
- operator quantity.
But if the product must move through the process on a dedicated carrier or fixture, then:
Carrier Quantity
can also limit production capacity.
Suppose the production equipment can achieve 2,000 PCS/H, but there are not enough process boards because many of them are currently in:
- welding;
- coating;
- curing;
- return circulation;
then the front-end equipment may stop because there is:
No Empty Board Available
Therefore:
Machine Capacity ≠ Line Capacity
The real production capacity also depends on:
Machine + Fixture + Carrier Turnover
Why NTC Welding Uses Dual Stations Instead of Simply Increasing Robot Speed
The confirmed capacity of the NTC resistance welding process is:
1,600–2,000 PCS/H
using a:
Dual-Station Welding Concept
For a welding process, increasing output cannot rely only on:
making the actuator move faster.
The actual cycle time also includes:
- product positioning;
- electrode motion;
- welding time;
- holding time;
- product release;
- loading of the next part.
Some of these times are determined by the process itself.
Compressing them too aggressively may directly affect welding stability.
The dual-station concept therefore allows:
one station to perform welding while the other prepares or changes the product.
In other words, it uses:
Parallelization
to reduce equipment waiting time rather than simply increasing the speed of each individual movement.
Why CCD Inspection Should Be Placed After Welding Instead of at the End of the Line
The project positions the optional AI CCD inspection immediately after NTC welding.
Inspection capacity is approximately:
1,800–2,400 PCS/H
using multiple cameras and AI vision software, while the material rack can buffer approximately:
20–30 Boards
This position is important.
After welding, the product still needs to go through:
- Silicone Coating;
- Curing;
- Housing Assembly;
- Epoxy Dispensing;
- Secondary Curing.
Each of these steps adds further:
Material + Machine Time + Production Value
If a welding defect is not detected until final testing, all of those downstream processes have already been wasted on an NG product.
A more effective quality-control logic is therefore:
Detect Defect Before Adding More Value
That means:
Welding
↓
Inspection
↓
Only Good Parts Continue
This is more efficient than concentrating all quality inspection at the end of the line.
Why CCD Capacity Should Be Slightly Higher Than the Upstream Process
The front-end wire cutting and board-loading equipment operates at approximately:
2,000–2,200 PCS/H
while the CCD system is designed for approximately:
1,800–2,400 PCS/H
The ranges are similar, but the CCD system has a slightly higher upper capacity.
This is a reasonable design approach.
If the inspection system’s maximum capacity were exactly equal to normal production speed, any:
- image-processing variation;
- product-position adjustment;
- NG reinspection;
- short interruption;
could immediately turn the inspection station into a bottleneck.
Inspection therefore needs a certain:
Capacity Margin
The goal is not to run the inspection station at 100% utilization every day.
The goal is:
to prevent it from becoming the limiting factor of the main production takt.
Why the Silicone Coating Machine Does Not Need to Follow the Main Line Takt Continuously
The silicone coating equipment in this project can reach:
10,000–14,000 PCS/H
which is much higher than the approximately 2,000 PCS/H capacity of the front-end process.
The project states that one coating machine operating for approximately:
4 Hours
can support the first and second coating operations required for approximately:
40,000 products
This means the process is not best understood as a continuous:
1 Product In → 1 Product Out
station.
It is better suited to:
Batch Processing
A certain quantity of products can be accumulated and then processed together.
This allows one high-speed coating machine to support the whole line without duplicating multiple machines simply to make the production flow look visually continuous.
Why the Curing Process Must Be Designed Around WIP Rather Than Only PCS/H
Curing is different from wire cutting or welding.
Its capacity cannot always be described simply as:
X PCS/H
because the real capacity depends on:
Curing Time
and:
How Many Products Can Be Cured at the Same Time
The project uses a tunnel oven, with each Wire Board carrying:
20 products
through the curing process.
The tunnel length is configured according to the actual curing time, while dedicated carriers are used for board transfer.
The curing-process logic is therefore closer to:
Required WIP = Production Rate × Curing Time
If curing takes a long time, a large number of products must be inside the curing process simultaneously.
Otherwise, the faster upstream equipment will quickly stop because the curing area is full.
So when designing an automated assembly line, some stations need to be evaluated by:
Cycle Time
while others must be evaluated by:
WIP Capacity
The same calculation method cannot be applied to both.
Why Epoxy Dispensing Returns to a Capacity Close to the Main Line Takt
The epoxy dispensing process uses:
Two Dispensing Valves
with a confirmed capacity of approximately:
1,800–2,500 PCS/H
For the planned output of 20,000 pcs/day, the project uses:
1 automatic Shell Insertion + Dispensing Machine
and plans approximately:
1,000 sets of Shell-Positioning Dispensing Fixtures
This shows that after the high-speed batch coating process, the line returns to a process capacity closer to the main production rate of:
~2,000 PCS/H
So the takt of this production line is not a flat line.
It is closer to:
Continuous Process
↓
Inspection
↓
High-Speed Batch Process
↓
Long-Duration Curing
↓
Continuous Dispensing
↓
Parallel Semi-Automatic Assembly
Different processes operate in different modes.
Why Two Terminal Crimping Machines Are Required
The confirmed capacity of the terminal crimping and housing insertion equipment is only:
800 PCS/H per machine
So the project plans:
2 Units
to support the required production capacity.
This is another way to increase throughput:
Parallel Equipment
When the output of a process is limited by mechanical motion, manual involvement, or the process itself, it may not be economical to develop one custom machine with twice the speed.
Sometimes a more practical option is to replace:
1 × 1,600 PCS/H Custom Machine
with:
2 × 800 PCS/H Standardized Machines
This also brings another advantage.
If one machine is temporarily under maintenance, the other can continue production.
That provides:
Production Redundancy
Why This Is Not a Completely Rigid Fully Automated Line
The process design shows that the line includes:
Automatic + Semi-Automatic + Manual Operations
This does not mean the project lacks automation.
It actually reflects a more practical manufacturing design principle.
The line can be understood as several:
Automation Islands
but these islands do not operate independently.
They are connected through:
- the same production plan;
- material carriers;
- WIP;
- quality status;
- test results.
Together, they form one continuous manufacturing flow.
Therefore:
Automated Assembly Line
does not necessarily mean:
once a product enters the first machine, no person ever touches it again.
A more useful definition is:
The key production steps are organized into a manageable and predictable manufacturing system through controlled equipment, standardized processes, and clearly defined material-flow interfaces.
Why Final Testing Is More Than Pass / Fail
The final performance testing in this project includes:
- Head Positioning;
- High-Voltage Insulation Testing;
- 25°C Resistance Testing;
- 85 ± 1°C High-Temperature Water-Bath Resistance Testing;
- Data Collection;
- Automatic NG Picking;
- Buffer Discharge.
The test equipment operates at approximately:
1,800–2,000 wires/hour
depending on manual loading speed, and uses:
PLC + Host Computer Control Software
This means the final process is not simply:
Check Product
It must establish a relationship between:
Product → Test Result → NG/OK Status → Data Record
For automotive temperature sensors, this step determines whether automated production can generate traceable quality records.
Why the Bottleneck of an Automated Assembly Line Can Change During Production
Looking only at equipment specifications, it is easy to assume:
the slowest machine will always be the bottleneck.
Actual production is more dynamic.
At one point, the bottleneck may be:
Welding Capacity
At another point, it may become:
Fixture Return
or:
Curing WIP
or:
Manual Loading at Testing
or even:
Terminal Crimping Queue
So the real line-design requirement is:
Capacity Balance
rather than identifying one theoretical “slowest machine.”
Each process needs enough capacity to support the production target while maintaining sufficient:
Buffer + Capacity Margin + Recovery Time
This allows short equipment interruptions or process variation to be absorbed without immediately affecting the entire line.
Why the Real Design Challenge Is the Relationship Between Processes
Looking at the equipment individually, this project can be divided into:
- Wire Cutting Machine;
- Welding Machine;
- CCD Inspection;
- Coating Machine;
- Tunnel Oven;
- Dispensing Machine;
- Crimping Machine;
- Test Equipment.
But simply purchasing these machines does not automatically create an effective production line.
The real design questions are:
Which Product Goes Where
When It Moves
How Many Products Wait
Which Fixture Carries It
Where NG Is Removed
Which Station Determines Capacity
What Happens When One Station Stops
These questions are what connect independent equipment into an:
Automated Assembly Line
So the engineering focus of this project is not to make every machine run as fast as possible.
It is to make:
equipment with different takt times, different process types, and different levels of automation work together reliably toward the 20,000 pcs/day production target.
Planning an Automated Assembly Line?
Robotlyne can evaluate your process sequence, cycle times, bottlenecks, fixture turnover, inspection strategy, and equipment capacity to develop a practical automation plan. Speak with Robotlyne about your automated assembly line project.